SciGraphs is an open-source Blender extension that brings graph ingestion, analysis, and high-fidelity 3D rendering into a single, reproducible pipeline. It turns abstract networks and real-world spatial graphs into native Blender objects driven by Geometry Nodes, mapping analytical results (centralities, communities, topological invariants) to named attributes that procedurally drive colour, scale, and animation.
It combines the analytical power of NetworkX, igraph, and Graphviz with Blender’s Cycles and EEVEE path-traced rendering, supporting two complementary domains:
- Combinatorial graphs — classical network metrics, community structure, and algorithmic layouts mapped procedurally via attribute-driven properties.
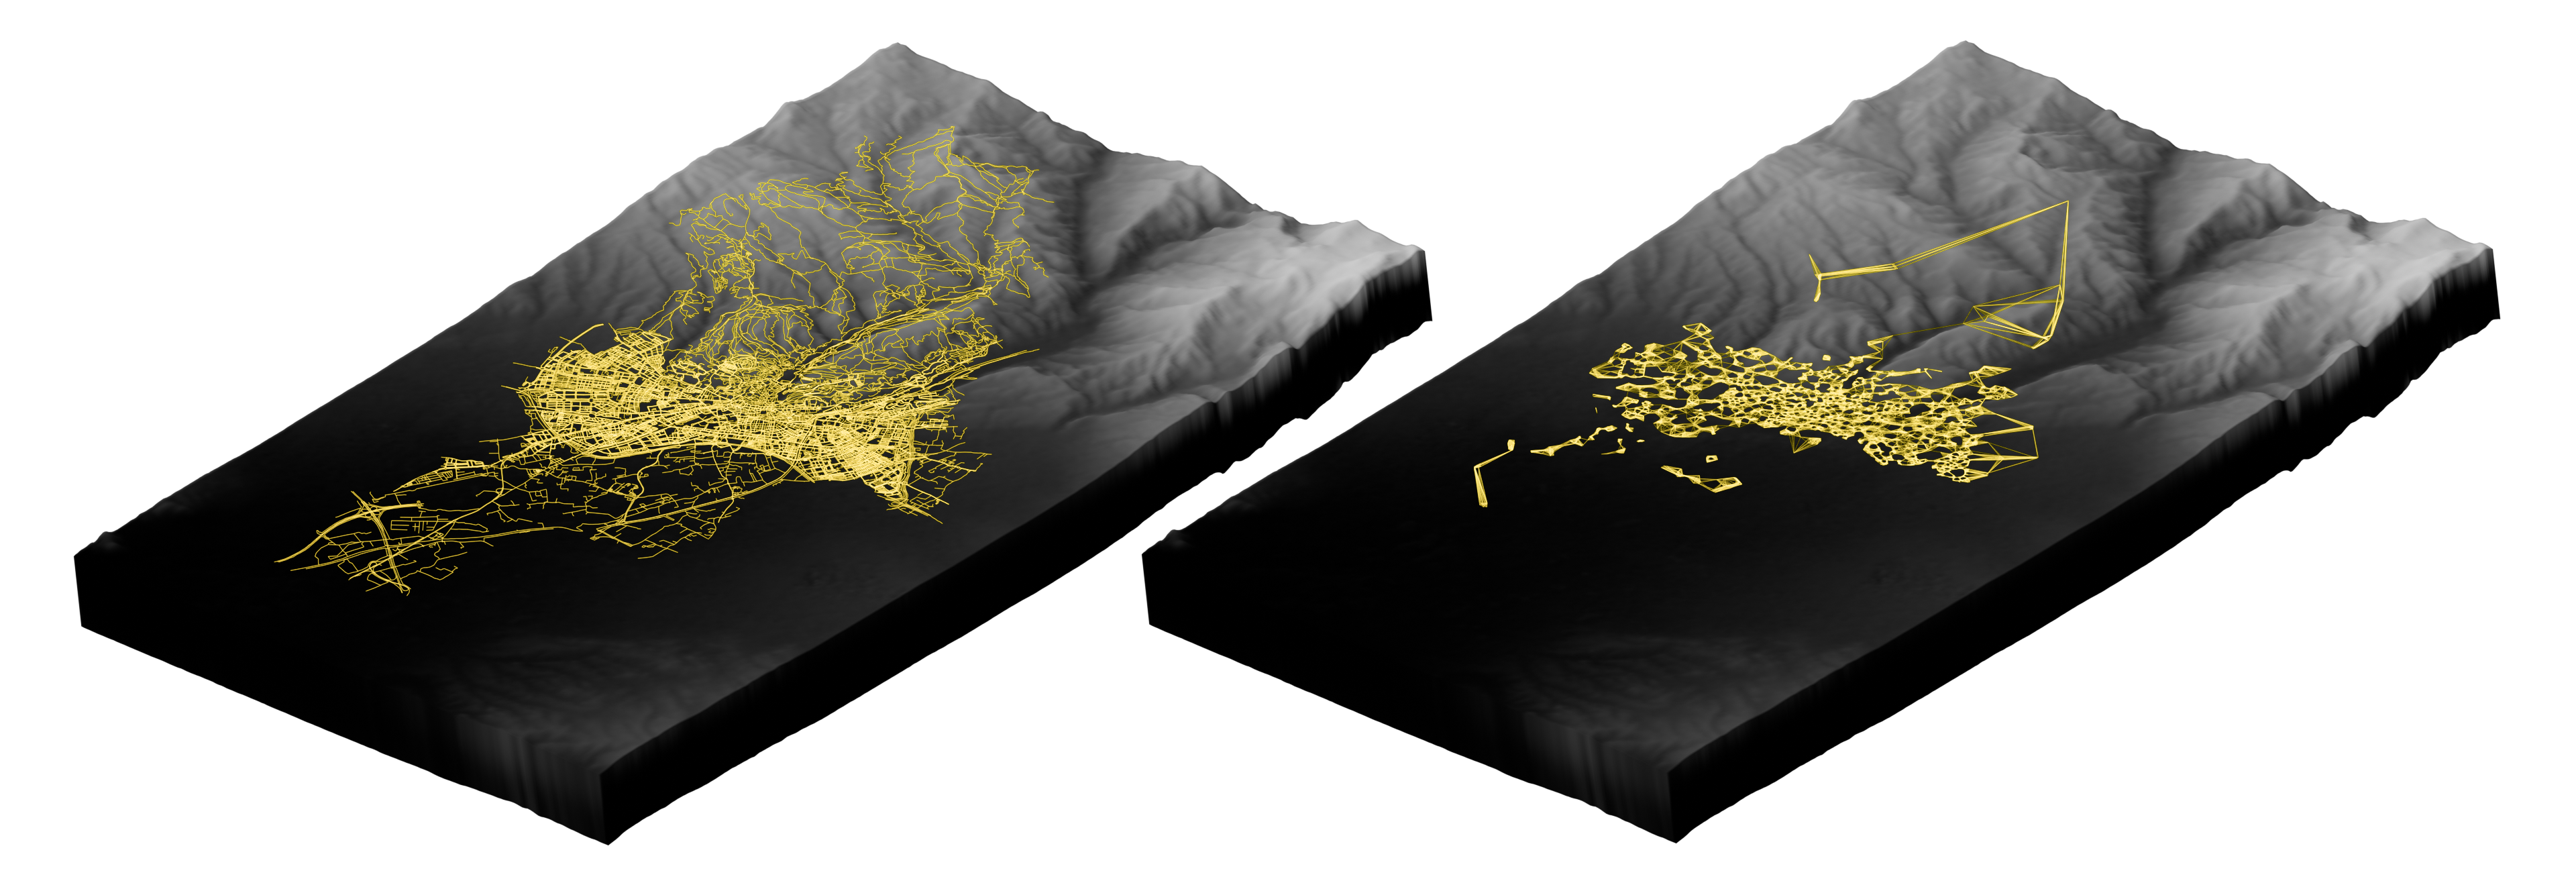
- Spatial and geometric graphs — networks visualized using their intrinsic coordinate data (geospatial, sparse-matrix, mesh) or laid out via topological analysis, including multi-layer urban morphologies through the City2Graph module.
Where to start
Guide
Concepts, installation, and the end-to-end workflow.
Panel Reference
A usage guide for every panel and subpanel in the sidebar.
Tutorials
Step-by-step walkthroughs of each panel, plus end-to-end examples.
Citing SciGraphs
SciGraphs is described in Visualization and Analysis of Graphs with SciGraphs, José Marín, Ignacio Marín, Ignacio García-Fernández, The Eurographics Association, 2026.
@article{marin2026visualization,
  title={Visualization and Analysis of Graphs with SciGraphs},
  author={Mar{\'\i}n, Jos{\'e} and Mar{\'\i}n, Ignacio and Garc{\'\i}a-Fern{\'a}ndez, Ignacio},
  year={2026},
  publisher={The Eurographics Association}
}