System architecture
SciGraphs follows a modular architecture running on top of Blender’s Python interpreter. The core is written in Python and designed to be extensible and maintainable across different graph types and use cases. The overall design decouples data acquisition, analysis, and visualization into separate modules that communicate through a common graph abstraction.
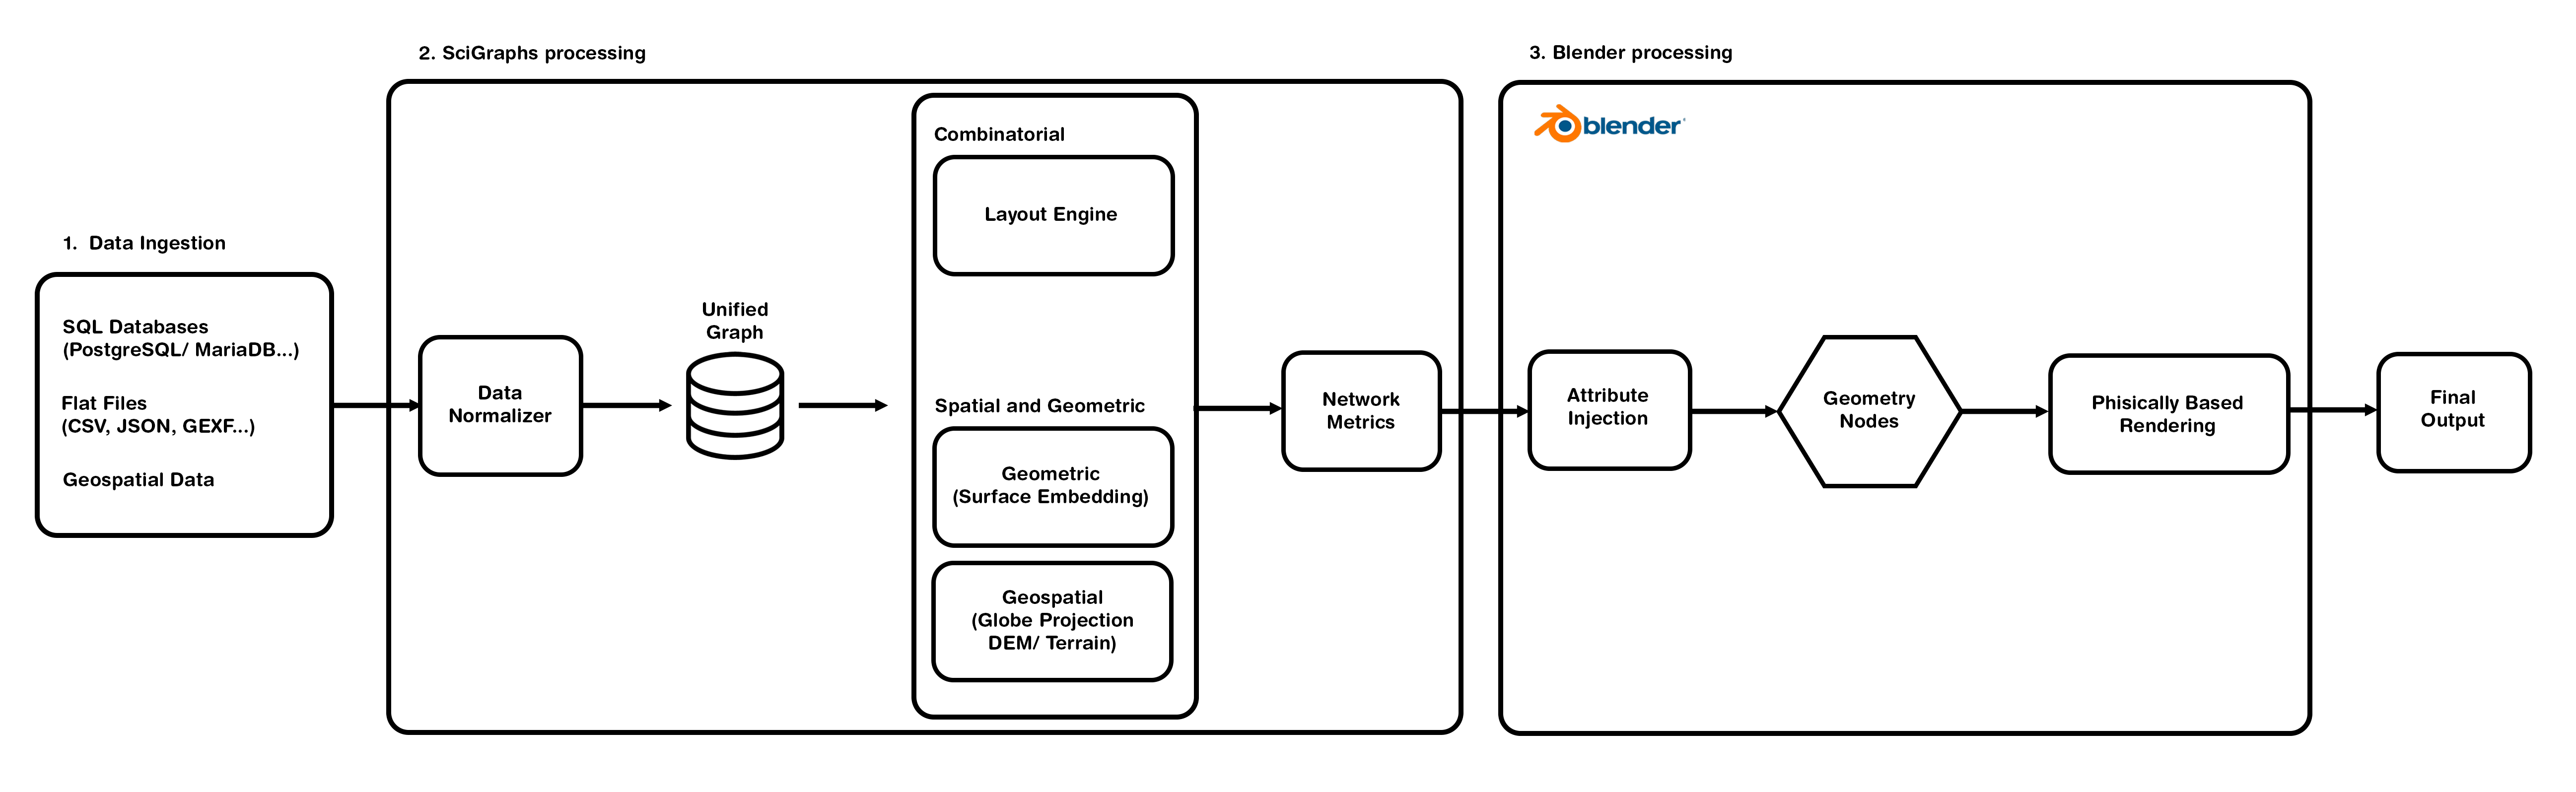
The unifying data structure
A unifying data structure stores the network as an adjacency list with node/edge attributes and bridges external libraries with Blender’s internal data. This abstraction lets SciGraphs treat diverse sources uniformly in the visualization pipeline. Graph metrics computed during analysis are injected into the Blender mesh as named attributes before visualization, so the same graph can be re-styled or animated on different attributes without repeating layout computations.
Bundled scientific stack
| Library | Role |
|---|---|
| NetworkX | Graph data structures and algorithms (traversal, centrality, clustering, community detection). |
| igraph | High-performance C++ layout algorithms (Fruchterman–Reingold, Kamada–Kawai, DrL, LGL, Davidson–Harel, Graphopt). |
| rustworkx | Fast graph operations used by the City2Graph module. |
| NumPy / SciPy | Array operations and linear algebra. |
| pandas | Tabular data handling. |
| OSMnx | Download and construct graph representations of OpenStreetMap data. |
| GeoPandas / Shapely / pyproj | Spatial operations and coordinate projection. |
| geopy | Geocoding services (Nominatim). |
| city2graph / momepy / libpysal | Heterogeneous urban network analysis. |
| overturemaps / pyarrow | Overture Maps REST/parquet access. |
| duckdb | GTFS and transportation analysis. |
| scikit-learn | Proximity-graph construction (KNN, etc.). |
| Pillow | Texture and imagery processing. |
scigraphs-utils |
Native Graphviz layout bindings (project-maintained). |
pysurprise |
SurpriseMe community detection and the Surprise metric (project-maintained). |
By embedding these analysis capabilities, SciGraphs avoids round-trip data exports and maintains an interactive environment where changes in the data or parameters are immediately reflected in the visualization.
Geometry Nodes and instancing
Naive approaches in Blender — creating an individual mesh object for every node — incur significant overhead due to dependency-graph evaluation. SciGraphs circumvents this by consolidating the entire graph into a single container object with internal point-cloud data, then using Geometry Nodes for procedural instancing of node spheres and edge cylinders.
This architecture sustains interactive viewport frame rates for networks well beyond \(10^5\) elements. In raw mode (graph stored as mesh topology) the viewport sustains over 60 FPS up to ~200,000 nodes and remains above 20 FPS at \(10^6\) nodes; in visual mode (after the Setup Visual operator) interactive rates are maintained up to ~500,000 nodes on consumer hardware.
Source layout
The codebase is organized into clearly separated concerns:
SciGraphs/
├── core/            # Analysis, layout, geometry, IO — no Blender UI
│   ├── algorithms/  # traversal, pathfinding, spanning, flow, topology, stats
│   ├── city2graph/  # urban morphology, proximity, transport, metapaths
│   ├── coloring/    # colormaps and attribute-driven coloring
│   ├── data_io/     # file/SQL/SuiteSparse importers and exporters
│   ├── geo/         # DEM, terrain, imagery, geospatial projection
│   ├── mesh/        # layouts, edge styles, geometry generation
│   ├── osmnx/       # download, routing, centrality, bearing, elevation
│   ├── repro/       # reproducible-pipeline executor, schema, provenance
│   └── visualization/ # animation, text overlay
├── properties/      # Blender PropertyGroups (scene settings)
├── ui/
│   ├── operators/   # Blender operators (the buttons that do the work)
│   └── panels/      # Blender panels (the sidebar UI documented here)
└── utils/           # dependency loading, logging, helpers
The Panel Reference in this documentation mirrors the ui/panels/ structure: each tab in the Blender sidebar corresponds to a panel group, and each subpanel corresponds to a collapsible section within it.