import pathlib
import sys
import time


def find_repo():
    """Locate the SciGraphs repository, without relying on the cwd.

    In a normal Jupyter the kernel starts per notebook with the cwd set to its
    folder. Not here: the kernel lives inside Blender and existed before you
    opened anything, so the cwd is wherever Blender was launched from. What the
    extension does know is which folder it is serving to JupyterLab.
    """
    candidates = []
    try:
        import bpy
        prefs = bpy.context.preferences.addons[
            "bl_ext.user_default.jupyter_blender"].preferences
        candidates.append(pathlib.Path(bpy.path.abspath(prefs.notebook_dir)))
    except Exception:
        pass
    candidates.append(pathlib.Path.cwd())

    for base in candidates:
        for directory in (base, *base.parents):
            if (directory / "SciGraphs" / "api" / "graphs.py").is_file():
                return directory

    raise RuntimeError(
        "Cannot find the SciGraphs repository. Point at it by hand:\n"
        "    sys.path.insert(0, '/path/to/SciGraphs-1/notebooks/tools')")


sys.path.insert(0, str(find_repo() / "notebooks" / "tools"))

import bpy
import math

# `nb` must import first: it puts this repository on sys.path, so the
# `SciGraphs` import below reads this tree, not the copy Blender installed.
import nb
from nb import check

from SciGraphs import api as sg

ox = nb.osmnx()

CENTER = (39.4699, -0.3763)      # Ciutat Vella, València
RADIUS_M = 600
METRIC_CRS = "EPSG:25830"

# Wider than the graph on purpose: the camera frames the graph plus a margin,
# so ground exactly as wide leaves a strip of backdrop down one side.
CONTEXT_RADIUS_M = 720

# 56 tiles and 0.92 m per pixel over this frame; section 2 measures why
# further zoom does not pay.
ZOOM = 1712 · Imagery
A photograph on the surface notebook 11 built. A graph on an empty field is a drawing of a topology; the same graph over the aerial photograph of the place is a claim you can check by looking, because every edge either lies on a street or does not. Half the notebook is the sources, what each one is for, what it costs in tiles and seconds and what you owe its publisher; half is the alignment that makes the claim checkable.
Including what a wrong one looks like. The georeference is deliberately shifted 250 m and the surface redraped, and the numeric alignment check still passes, because it measures the mesh and the mesh has not moved. Only the photograph gives it away, which is worth knowing before you trust a check that returns True.
Nothing here needs an API key: thirteen tile sources and any WMS endpoint you name are open.
For the same basemaps from the sidebar, see the basemap tutorial and the Features panel.
12 · Imagery: draping real pictures on the ground
Notebook 11 built a surface out of numbers; this one puts a photograph on it. A graph over the aerial photograph of the place is a claim you can check by looking: every edge either lies on a street or does not.
Ciutat Vella, València, the same 600 m as the rest of the suite. No API key: thirteen tile sources and any WMS endpoint you name are open.
0 · Setup
Switches
RUN_WMS: one GetMap against a third-party endpoint that can be down. About 2.5 s and 4 MB when it is up. Off by default: a failure here is somebody else’s outage.RUN_ZOOM_18: one extra drape at zoom 18, 182 tiles instead of 56 and about 4.7 MB, for detail no figure at 900 px can show. Off by default.
RUN_WMS = False
RUN_ZOOM_18 = False

# Any WMS serving EPSG:4326 GetMap here works. The intended one is a national
# orthophoto service (Spain's PNOA, `OI.OrthoimageCoverage`), but it answered
# HTTP 502 every time this was measured, so the default is one that responds.
WMS_URL = "https://ows.terrestris.de/osm/service"
WMS_LAYER = "OSM-WMS"
1 · The catalog
sg.context.imagery_sources() lists what can be fetched without a key, with the deepest zoom each service actually serves. Thirteen entries, four providers, each drawn for a different job:
| Source | What it is for |
|---|---|
ESRI_IMAGERY |
Satellite: roofs, trees, car parks. The default when the figure has to be believed. |
ESRI_STREET |
Labeled road map. The alignment check: streets and graph edges are the same objects. |
ESRI_TOPO |
Relief shading plus roads and place names. |
ESRI_DARK_GRAY |
Dark canvas: coastlines, major roads, faint labels. A background for data. |
ESRI_LIGHT_GRAY |
The same for print, on white. |
ESRI_HILLSHADE |
Relief only. Pairs with a DEM figure. |
ESRI_OCEAN |
Bathymetry. Stops at zoom 13; over a city, a blue rectangle. |
ESRI_TERRAIN |
Small-scale shaded relief. Also stops at 13. |
OSM |
Standard OpenStreetMap rendering: dense, labeled, opinionated. |
OPENTOPOMAP |
Contours and hillshading over OSM data. |
CARTO_VOYAGER |
Colored basemap, quieter than OSM. |
CARTO_POSITRON |
Light canvas for data overlay. |
CARTO_DARK_MATTER |
Dark canvas for data overlay. |
Context against canvas is the split that matters: a satellite image is high-frequency detail at every luminance and competes with whatever you draw on it, where a canvas is deliberately empty and dim. Choosing the first when you meant the second is the commonest way an overlay figure becomes unreadable.
catalog = sg.context.imagery_sources()
print(f"\n{len(catalog)} sources, none of them needing a key")
check("every cataloged source is keyless", len(catalog) == 13)
ESRI_IMAGERY Esri · Satellite (World Imagery) max zoom 19
ESRI_STREET Esri · Streets max zoom 19
ESRI_TOPO Esri · Topographic max zoom 19
ESRI_DARK_GRAY Esri · Dark Gray Canvas max zoom 16
ESRI_LIGHT_GRAY Esri · Light Gray Canvas max zoom 16
ESRI_OCEAN Esri · Ocean Base max zoom 13
ESRI_HILLSHADE Esri · Hillshade max zoom 16
ESRI_TERRAIN Esri · Terrain Base max zoom 13
OSM OpenStreetMap · Standard max zoom 19
OPENTOPOMAP OpenTopoMap · Topographic max zoom 17
CARTO_VOYAGER CARTO · Voyager max zoom 20
CARTO_POSITRON CARTO · Positron (Light) max zoom 20
CARTO_DARK_MATTER CARTO · Dark Matter max zoom 20
13 sources, none of them needing a key
[PASS] every cataloged source is keylessTrueWhat you owe them
Esri’s terms of use, the OpenStreetMap tile usage policy and CARTO’s basemap terms all require the attribution string on anything published that uses the tiles. sg.context.imagery() stores it on the terrain object and sg.context.attribution() prints it.
The OSM policy also requires a User-Agent identifying the application, and rules out bulk downloading. sg.context appends its own suffix to the add-on’s User-Agent during a fetch, caps a request at 256 tiles, and caches every tile on disk.
for key in ("ESRI_IMAGERY", "OSM", "CARTO_POSITRON", "OPENTOPOMAP"):
    print(f"  {key:<16} {catalog[key]['attribution']}")
ESRI_IMAGERY Tiles © Esri — Source: Esri, Maxar, Earthstar Geographics, and the GIS User Community
OSM © OpenStreetMap contributors
CARTO_POSITRON © OpenStreetMap contributors © CARTO
OPENTOPOMAP © OpenStreetMap contributors, SRTM — © OpenTopoMap (CC-BY-SA)2 · Zoom against tiles against seconds
A slippy-map zoom level doubles linear resolution, so it quadruples tiles. sg.context.imagery_estimate() computes the budget without fetching anything: the tile rectangle, how many are already on disk, and the composite size.
bounds = sg.context.bounds_around(CENTER, CONTEXT_RADIUS_M)
span_m = 2 * CONTEXT_RADIUS_M

def meters_per_pixel(latitude, zoom):
    """Ground resolution of a Web Mercator tile pyramid, in meters.

    The equator is 40 075 016.686 m and level `z` covers it in `2**z x 256`
    pixels; the scale shrinks with the cosine of the latitude. Computed rather
    than read off `image_size`, because that field is the tile canvas, always a
    little larger than the rectangle actually asked for.
    """
    return 156543.03392 * math.cos(math.radians(latitude)) / (2 ** zoom)


print(f"{'zoom':>5} {'tiles':>7} {'m/px':>7} {'px across the frame':>21} "
      f"{'cached':>7}  limit")
for zoom in range(15, 20):
    estimate = sg.context.imagery_estimate(bounds, "ESRI_IMAGERY", zoom,
                                           verbose=False)
    resolution = meters_per_pixel(CENTER[0], zoom)
    print(f"{zoom:>5} {estimate['tiles']:>7} {resolution:>7.2f} "
          f"{span_m / resolution:>21.0f} {estimate['cached']:>7}  "
          f"{'REFUSED' if estimate['over_limit'] else 'ok'}")

over = sg.context.imagery_estimate(bounds, "ESRI_IMAGERY", 19, verbose=False)
check("zoom 19 is refused before it is requested", over["over_limit"],
      f"{over['tiles']} tiles against a ceiling of {sg.context.MAX_TILES}")
zoom tiles m/px px across the frame cached limit
15 6 3.69 390 6 ok
16 20 1.84 781 0 ok
17 56 0.92 1562 56 ok
18 182 0.46 3124 0 ok
19 650 0.23 6247 0 REFUSED
[PASS] zoom 19 is refused before it is requested — 650 tiles against a ceiling of 256TrueThese renders are 900 px across a 1.44 km frame, 1.6 m per rendered pixel, so zoom 17 at 0.92 m/px already carries more detail than the render can show and zoom 18 quadruples the traffic for pixels that are averaged away. Fetch zoom 18 once if you intend to crop in: a tile fetched once is on disk under the system temp directory and never fetched again, so the second run spends no network. Cold, the 56-tile zoom-17 request measured about a second; warm, a fraction.
Per-source ceilings differ. Esri Ocean and Terrain stop at zoom 13; the two gray canvases and Hillshade at 16; OpenTopoMap at 17. fetch_basemap clamps silently, so asking Ocean for zoom 17 here returns zoom 13, about 15 m per pixel, under a hundred pixels across 1.44 km, stretched over the whole surface. imagery_estimate clamps first and says so, which is the only warning you get.
for source in ("ESRI_IMAGERY", "ESRI_DARK_GRAY", "ESRI_OCEAN"):
    estimate = sg.context.imagery_estimate(bounds, source, ZOOM, verbose=False)
    note = (f"clamped from {estimate['zoom_requested']}"
            if estimate["zoom_clamped"] else "as requested")
    resolution = meters_per_pixel(CENTER[0], estimate["zoom"])
    print(f"  {source:<16} zoom {estimate['zoom']:>2} ({note:<16}) "
          f"{estimate['tiles']:>3} tiles, {resolution:>6.2f} m/px, "
          f"{span_m / resolution:>4.0f} px across the frame")
ESRI_IMAGERY zoom 17 (as requested ) 56 tiles, 0.92 m/px, 1562 px across the frame
ESRI_DARK_GRAY zoom 16 (clamped from 17 ) 20 tiles, 1.84 m/px, 781 px across the frame
ESRI_OCEAN zoom 13 (clamped from 17 ) 2 tiles, 14.75 m/px, 98 px across the frame3 · The scene
A drive network over Ciutat Vella, with a ground surface under it. No buildings: they are notebook 17’s subject, and from overhead an extruded footprint hides precisely the part of the photograph the graph is checked against.
add_context does terrain, materials, imagery and vertical placement in one call, and the order inside is load-bearing: style_context() calls data.materials.clear(), so a drape applied before it is silently wiped and what comes out is a gray plane that looks exactly like a failed fetch. Styling first, drape second, settle() last because it needs the finished stack to measure; it only moves Z, so the UVs survive, depending on XY alone.
Cost: one OSM download (cached after the first run), one elevation fetch of about 1.5 s, one imagery fetch of about 1 s.
G = ox.graph_from_point(CENTER, dist=RADIUS_M, network_type="drive", simplify=True)
nodes_ox, edges_ox = ox.graph_to_gdfs(G)

nodes = nodes_ox.to_crs(METRIC_CRS)[["geometry"]]
nodes.index.name = "node_id"

# OSMnx indexes edges by (u, v, key) because it allows parallel segments;
# `graph_to_blender` expects (source, target). Keep the shortest of each pair.
edges = (edges_ox.to_crs(METRIC_CRS).reset_index()
         .sort_values("length")
         .drop_duplicates(subset=["u", "v"])
         .set_index(["u", "v"])[["length", "geometry"]])

print(f"{len(nodes)} intersections, {len(edges)} segments, "
      f"{edges['length'].sum() / 1000:.1f} km")

sg.graphs.clear_scene(keep_anchor=False)
anchor = sg.graphs.anchor(CENTER[0], CENTER[1], scale=0.001, name="Anchor_Imagery")
net = sg.graphs.from_gdf(nodes, edges, name="Street_Network", ref=anchor,
                         coll="SGNB_Imagery",
                         markers={"graph_type": "street_network"})
print(sg.graphs.summary(net))
193 intersections, 292 segments, 22.6 km
{'object': 'Street_Network', 'type': 'MESH', 'num_nodes': 193, 'num_edges': 279, 'is_directed': False, 'vertices': 193, 'mesh_edges': 279, 'attributes': ['position', '.edge_verts', '.corner_vert', '.corner_edge', 'node_id', 'edge_length'], 'graph_type': 'street_network'}# `"auto"`, not `"dem"`: the relief here is scenery, 27 m over 1.44 km, and
# `"dem"` raises when the elevation service is unreachable (open-elevation has
# timed out here). Notebook 11, where elevation is the subject, insists on it.
started = time.time()
ctx = sg.context.add_context(net, CENTER, CONTEXT_RADIUS_M, anchor,
buildings_gdf=False,
terrain_source="auto", resolution=24,
imagery="ESRI_IMAGERY", imagery_zoom=ZOOM)
print(f"\ncontext built in {time.time() - started:.1f} s")
sg.context.report(ctx["objects"])
surface = ctx["terrain"]
print("real elevation under the photograph:", ctx["real_elevation"])
if not ctx["real_elevation"]:
print(" the elevation service was unreachable, so this is a flat plane;")
print(" at 27 m of relief across 1.44 km the drape is unaffected either way")
check("the surface is wearing real imagery", ctx["real_imagery"],
"False here means the fetch failed and the terrain fell back to the "
"matte palette: gray because there is no photograph, rather than "
"because the photograph is gray") open-elevation probe: unreachable (10.48 s, ReadTimeout: HTTPSConnectionPool(host='api.open-elevation.com', port=443): Read timed out. (read timeout=10.0))
FALLING BACK TO A FLAT PLANE: open-elevation is unreachable (ReadTimeout: HTTPSConnectionPool(host='api.open-elevation.com', port=443): Read timed out. (read timeout=10.0)). This is NOT elevation data.
Creating terrain mesh: 2x2 vertices
Terrain mesh created: 4 vertices, 1 faces
flat ground, 1440 x 1440 m (no elevation data)
Esri · Satellite (World Imagery): 8x7 = 56 tiles at zoom 17, 2048x1792 px
56 already cached, 0 to fetch (~0.0 MB)
Basemap: ESRI_IMAGERY z=17 → 8×7=56 tiles (2048×1792 px)
Basemap saved: /tmp/scigraphs_basemaps/_composites/basemap_esri_imagery_z17_1787036002.png (1564×1564 px, 0/56 failed tiles)
scigraphs-utils available - Graphviz layouts enabled
Esri · Satellite (World Imagery): 1564x1564 px in 0.4 s (56 tiles from cache)
Tiles © Esri — Source: Esri, Maxar, Earthstar Geographics, and the GIS User Community
context moved -0.00100 Blender units (-1.0 m) so the ground clears z=0 by 1 m
[PASS] Context_Ground aligned with Street_Network — center off by 0.0061 BU (0.36% of the graph diagonal), covers 100.0% of it, 1.21x its width
context built in 10.8 s
Context_Ground ground 1.440 x 1.440 x 0.000 BU source=flat real_elevation=False imagery=ESRI_IMAGERY@z17 (56 tiles)
real elevation under the photograph: False
the elevation service was unreachable, so this is a flat plane;
at 27 m of relief across 1.44 km the drape is unaffected either way
[PASS] the surface is wearing real imagery — False here means the fetch failed and the terrain fell back to the matte palette: gray because there is no photograph, rather than because the photograph is grayTrue250 intersections on the aerial photograph of the streets they are intersections of. Every node should sit on a junction, every edge should follow a carriageway. The test is done by looking.
nb.figure(net, "renders/08_imagery/1_satellite",
          isolate=False, resolution=(900, 900), look='terrain',
          node_fraction=0.28, width=860, legible=False)
sg.context.attribution(ctx["objects"])
Promoted 1 edge attribute(s) to point domain for GN propagation
Info: Geometry Nodes modifier added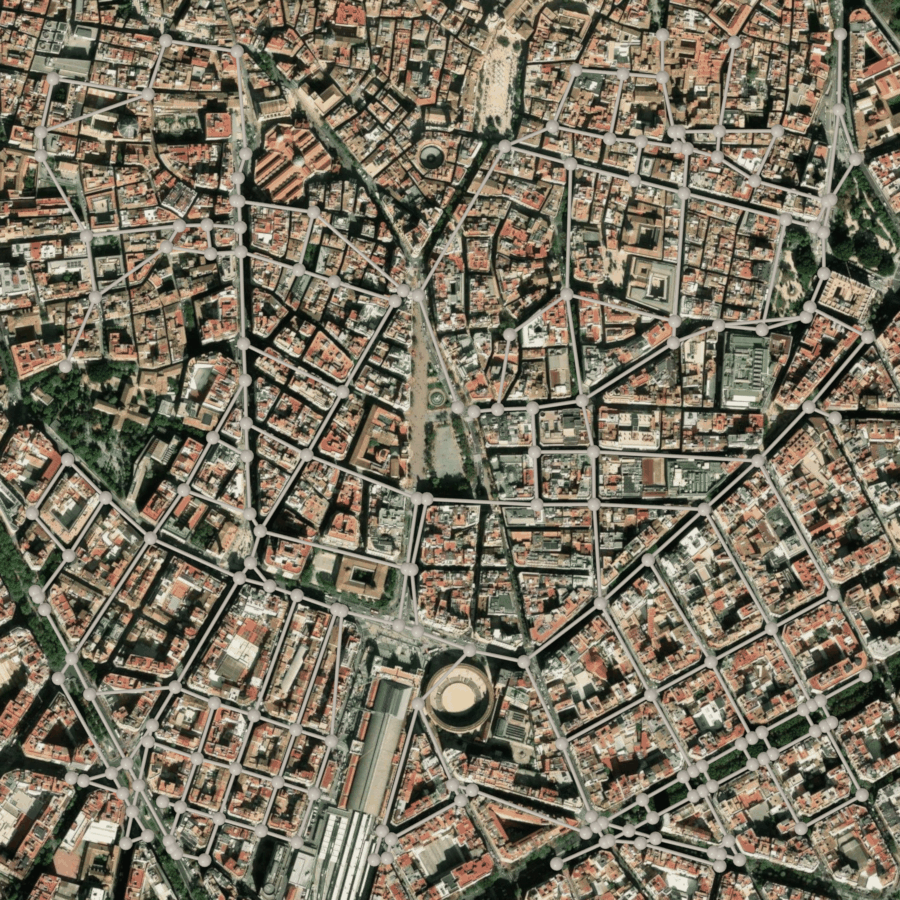
Tiles © Esri — Source: Esri, Maxar, Earthstar Geographics, and the GIS User Community4 · The same graph on five other grounds
One drape per source, same camera, same graph; each answers a different question. Cost: five fetches, 12 to 36 tiles each, a second or two apiece and nothing at all on a re-run.
GALLERY = [
("ESRI_STREET", ZOOM, "a labeled road map, the alignment check"),
("ESRI_TOPO", 16, "relief plus roads and place names"),
("CARTO_POSITRON", ZOOM, "light canvas: the data is the only ink"),
("CARTO_DARK_MATTER", ZOOM, "dark canvas, same idea inverted"),
("ESRI_HILLSHADE", 16, "relief alone, flat here by construction"),
]
for source, zoom, purpose in GALLERY:
result = sg.context.imagery(surface, source=source, zoom=zoom, verbose=False)
# A down or rate-limiting tile server reports through `source_name=None`
# rather than raising.
if result.get("source_name") is None:
print(f"{source:<38} unavailable: {result.get('error', 'no detail given')}")
continue
print(f"{result['source_name']:<38} zoom {result['zoom']:>2} "
f"{result['tiles']:>2} tiles {result['seconds']:>4.1f} s "
f"({result['cached']} cached)")
print(f" {purpose}")
nb.figure(net, f"renders/08_imagery/2_{source.lower()}",
isolate=False, resolution=(620, 620), look='terrain',
node_fraction=0.28, width=560, legible=False)Basemap: ESRI_STREET z=17 → 8×7=56 tiles (2048×1792 px)
Basemap saved: /tmp/scigraphs_basemaps/_composites/basemap_esri_street_z17_1787036003.png (1564×1564 px, 0/56 failed tiles)
Esri · Streets zoom 17 56 tiles 0.4 s (56 cached)
a labeled road map, the alignment check
  Promoted 1 edge attribute(s) to point domain for GN propagation
Info: Geometry Nodes modifier added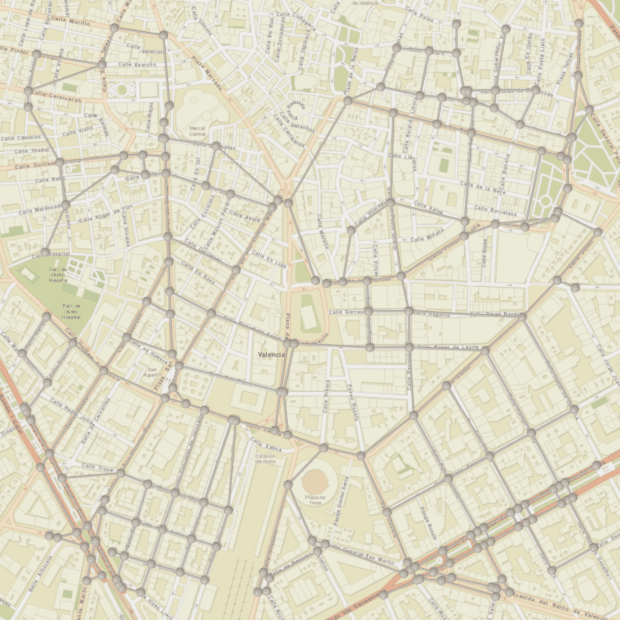
Basemap: ESRI_TOPO z=16 → 5×4=20 tiles (1280×1024 px)
Basemap saved: /tmp/scigraphs_basemaps/_composites/basemap_esri_topo_z16_1787036003.png (782×781 px, 0/20 failed tiles)
Esri · Topographic                     zoom 16  20 tiles   0.1 s  (20 cached)
    relief plus roads and place names
  Promoted 1 edge attribute(s) to point domain for GN propagation
Info: Geometry Nodes modifier added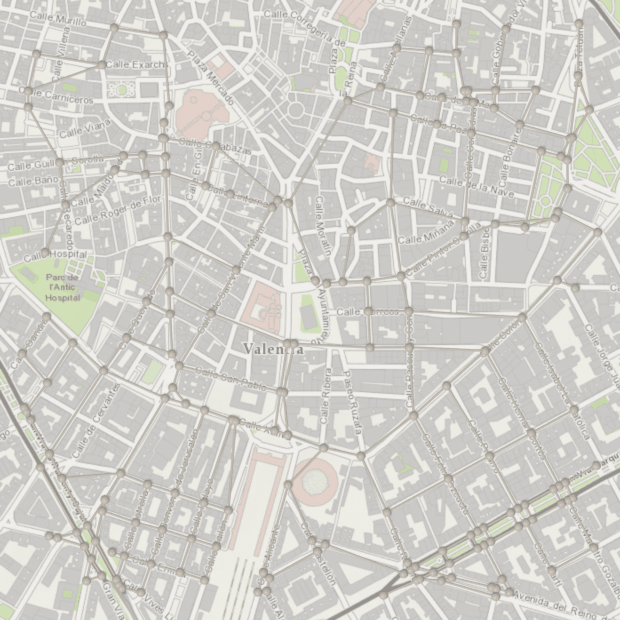
Basemap: CARTO_POSITRON z=17 → 8×7=56 tiles (2048×1792 px)
Basemap saved: /tmp/scigraphs_basemaps/_composites/basemap_carto_positron_z17_1787036004.png (1564×1564 px, 0/56 failed tiles)
CARTO · Positron (Light)               zoom 17  56 tiles   0.2 s  (56 cached)
    light canvas: the data is the only ink
  Promoted 1 edge attribute(s) to point domain for GN propagation
Info: Geometry Nodes modifier added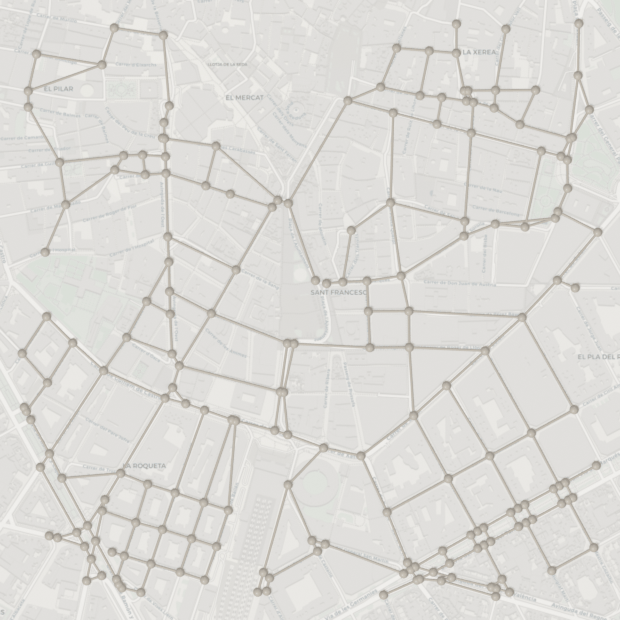
Basemap: CARTO_DARK_MATTER z=17 → 8×7=56 tiles (2048×1792 px)
Basemap saved: /tmp/scigraphs_basemaps/_composites/basemap_carto_dark_matter_z17_1787036004.png (1564×1564 px, 0/56 failed tiles)
CARTO · Dark Matter                    zoom 17  56 tiles   0.2 s  (56 cached)
    dark canvas, same idea inverted
  Promoted 1 edge attribute(s) to point domain for GN propagation
Info: Geometry Nodes modifier added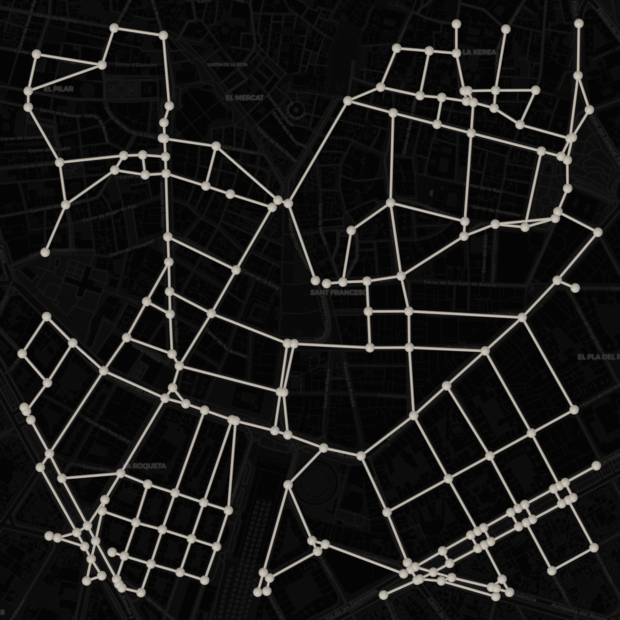
Basemap: ESRI_HILLSHADE z=16 → 5×4=20 tiles (1280×1024 px)
Basemap saved: /tmp/scigraphs_basemaps/_composites/basemap_esri_hillshade_z16_1787036005.png (782×781 px, 0/20 failed tiles)
Esri · Hillshade                       zoom 16  20 tiles   0.1 s  (20 cached)
    relief alone, flat here by construction
  Promoted 1 edge attribute(s) to point domain for GN propagation
Info: Geometry Nodes modifier added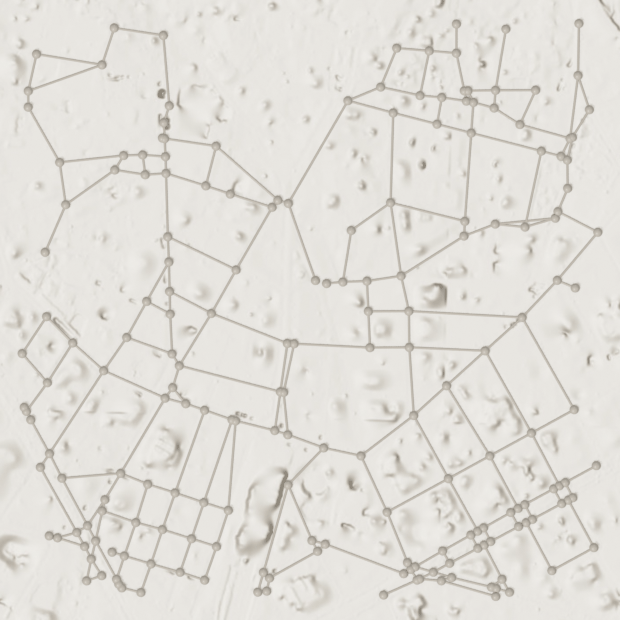
The equivalent operator. In Blender the same fetch is
bpy.ops.scigraphs.osmnx_fetch_basemap(), driven byscene.scigraphs.osmnx_basemap_source,osmnx_basemap_zoom,osmnx_basemap_paddingand, for WMS,osmnx_wms_url/osmnx_wms_layer. Itspolldemands an active object carryingis_osmnxand an attached terrain child, which a graph built from GeoDataFrames has neither of, so it cannot run here.sg.context.imagery()reaches the same two functions,imagery.fetch_basemapand_project_uv_geographic, without those preconditions: neither cares about anything but the terrain mesh and its DEM properties. The operator uses a 400-tile ceiling where this module uses 256.
5 · Alignment
The picture and the graph come from different services in different projections and land in the same frame. One chain does it, per vertex:
create_terrain_meshstampeddem_center_lat,dem_center_lonanddem_scaleon the object: the parameters of the equirectangular-local projection it used._project_uv_geographicinverts that per vertex, world XY back to a real (lat, lon).imagery.latlon_to_image_uvmaps that into the image using the georeference the fetch produced, not the one requested: XYZ tiles snap to integer tile boundaries and the composite is cropped to whole pixels, so the two differ.fetch_basemapreturns the rounded rectangle in Mercator tile units.- Two image projections,
WEB_MERCATORfor XYZ tiles andWGS84_LINEARfor a WMSGetMapin EPSG:4326, each with its own inverse.
So the fetched box need not match the mesh: ask with padding=0.25 and you get a wider photograph the mesh maps into the middle of, still aligned. What must match is the mesh’s own record of where it is. The corners are the cheap check.
from scigraphs_core.geo import imagery as sg_imagery

terrain_box = {k: float(surface[f"dem_bounds_{k}"])
               for k in ("north", "south", "east", "west")}
_image, metadata = sg_imagery.fetch_basemap(bounds=terrain_box,
                                            source="ESRI_STREET", zoom=ZOOM)

corners = {"NW": (terrain_box["north"], terrain_box["west"]),
           "NE": (terrain_box["north"], terrain_box["east"]),
           "SW": (terrain_box["south"], terrain_box["west"]),
           "SE": (terrain_box["south"], terrain_box["east"])}
print(f"projection: {metadata['projection']}")
uvs = {}
for name, (lat, lon) in corners.items():
    uvs[name] = sg_imagery.latlon_to_image_uv(lat, lon, metadata)
    print(f"  {name}  u={uvs[name][0]:+.5f}  v={uvs[name][1]:+.5f}")

worst = max(abs(value - round(value)) for uv in uvs.values() for value in uv)
check("the terrain's corners land on the image's corners", worst < 1e-3,
      f"largest deviation from 0 or 1 is {worst:.2e} in UV, which over "
      f"{2 * CONTEXT_RADIUS_M:.0f} m is {worst * 2 * CONTEXT_RADIUS_M * 100:.2f} cm")
Basemap: ESRI_STREET z=17 → 8×7=56 tiles (2048×1792 px)
Basemap saved: /tmp/scigraphs_basemaps/_composites/basemap_esri_street_z17_1787036005.png (1564×1564 px, 0/56 failed tiles)
projection: WEB_MERCATOR
NW u=+0.00031 v=+0.99979
NE u=+1.00007 v=+0.99979
SW u=+0.00031 v=+0.00003
SE u=+1.00007 v=+0.00003
[PASS] the terrain's corners land on the image's corners — largest deviation from 0 or 1 is 3.12e-04 in UV, which over 1440 m is 44.98 cmTrueWhat the numeric check can and cannot see
sg.context.check_alignment() compares bounding boxes in Blender XY: how far the context’s center is from the graph’s, as a fraction of the graph’s diagonal, and how much of the graph falls inside the context. It catches a wrong anchor and a wrong scale, both common.
It cannot catch a wrong photograph, because the photograph is not geometry: the mesh has not moved, only the pixels on it are of somewhere else. The next two cells corrupt the recorded georeference by 250 m, the failure a terrain from one source and a bounding box from another produces.
recorded = dict(terrain_box)
shift_deg = 250.0 * 180.0 / (math.pi * 6371000.0)
surface["dem_bounds_north"] = recorded["north"] + shift_deg
surface["dem_bounds_south"] = recorded["south"] + shift_deg

sg.context.imagery(surface, source="ESRI_STREET", zoom=ZOOM, verbose=False)
alignment = sg.context.check_alignment(net, [surface])

check("the numeric check passes on a drape that is 250 m out",
      bool(alignment and alignment["ok"]),
      "which is the point: it is measuring the mesh, and the mesh is "
      "where it always was")

nb.figure(net, "renders/08_imagery/3_misaligned",
          isolate=False, resolution=(720, 720), look='terrain',
          node_fraction=0.28, width=660, legible=False)
Basemap: ESRI_STREET z=17 → 8×8=64 tiles (2048×2048 px)
Basemap saved: /tmp/scigraphs_basemaps/_composites/basemap_esri_street_z17_1787036006.png (1564×1564 px, 0/64 failed tiles)
[PASS] Context_Ground aligned with Street_Network — center off by 0.0061 BU (0.35% of the graph diagonal), covers 100.0% of it, 1.19x its width
[PASS] the numeric check passes on a drape that is 250 m out — which is the point: it is measuring the mesh, and the mesh is where it always was
Promoted 1 edge attribute(s) to point domain for GN propagation
Info: Geometry Nodes modifier added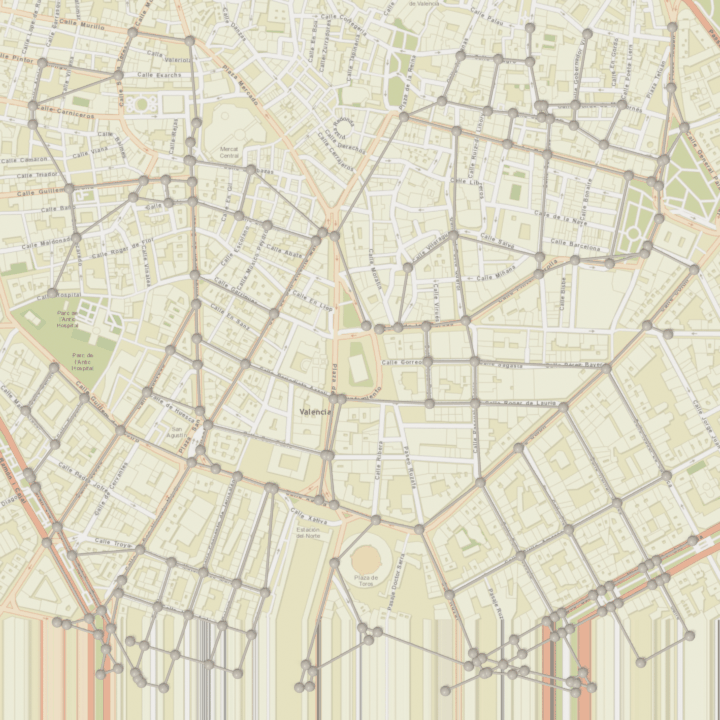
Compare that frame with the next. Two tells, and the second is the reliable one.
The alignment itself: the network runs across the blocks instead of along the streets, uniformly, everywhere. 250 m out of 1400 is a sixth of the frame, obvious once you follow a named street and easy to miss at a glance.
The band of vertical streaks along the bottom edge. The photograph was fetched for a rectangle 250 m further north than the mesh, so the southern sixth has no image under it; the texture node’s EXTEND mode repeats the last row of pixels, and a repeated row of a street map is a comb of colored verticals. Any smeared edge in a drape means the mesh is asking for pixels the image does not have: always a georeference disagreement, never a rendering artifact.
The signature says which. A rigid shift is a wrong bounding box. A stretch that grows toward one edge is a wrong projection: a Web Mercator image mapped as if linear in latitude does exactly that, zero error at the center, worst at top and bottom. A rotation means the anchor latitude is wrong enough to change the longitude scaling.
for key, value in recorded.items():
    surface[f"dem_bounds_{key}"] = value

sg.context.imagery(surface, source="ESRI_STREET", zoom=ZOOM, verbose=False)
nb.figure(net, "renders/08_imagery/4_aligned",
          isolate=False, resolution=(720, 720), look='terrain',
          node_fraction=0.28, width=660, legible=False)
Basemap: ESRI_STREET z=17 → 8×7=56 tiles (2048×1792 px)
Basemap saved: /tmp/scigraphs_basemaps/_composites/basemap_esri_street_z17_1787036006.png (1564×1564 px, 0/56 failed tiles)
Promoted 1 edge attribute(s) to point domain for GN propagation
Info: Geometry Nodes modifier added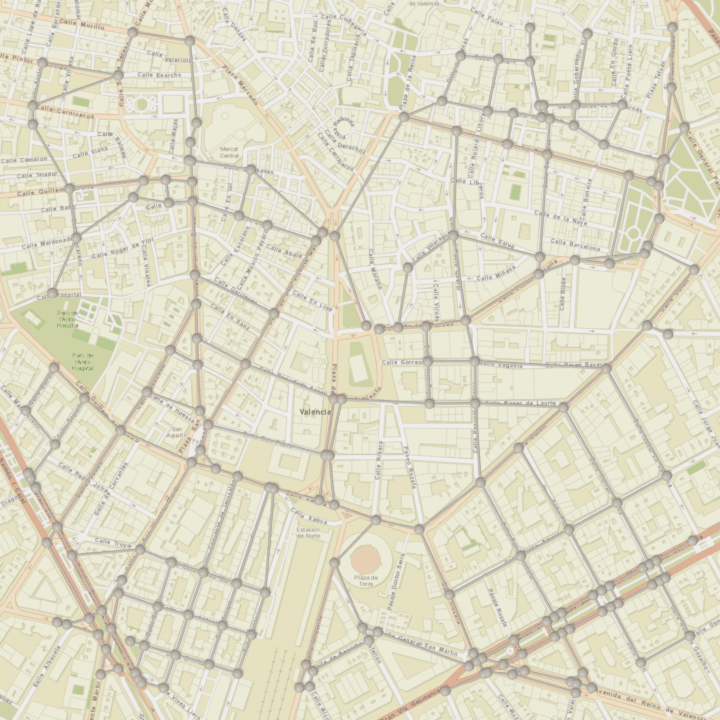
6 · Zoom, seen rather than estimated
Zoom 15 against zoom 17 over the same frame: six tiles against fifty-six, 3.7 m per pixel against 0.92. At the size these figures are shown, the difference is the individual buildings.
for zoom in (15, ZOOM):
    result = sg.context.imagery(surface, source="ESRI_IMAGERY", zoom=zoom,
                                verbose=False)
    print(f"zoom {zoom}: {result['tiles']} tiles, "
          f"{result['image_size'][0]} x {result['image_size'][1]} px, "
          f"{result['seconds']:.2f} s")
    nb.figure(net, f"renders/08_imagery/5_zoom_{zoom}",
              isolate=False, resolution=(700, 700), look='terrain',
              node_fraction=0.28, width=640, legible=False)

if RUN_ZOOM_18:
    result = sg.context.imagery(surface, source="ESRI_IMAGERY", zoom=18,
                                verbose=False)
    print(f"zoom 18: {result['tiles']} tiles, "
          f"{result['image_size'][0]} x {result['image_size'][1]} px, "
          f"{result['seconds']:.1f} s")
    nb.figure(net, "renders/08_imagery/5_zoom_18",
              isolate=False, resolution=(700, 700), look='terrain',
              node_fraction=0.28, width=640, legible=False)
else:
    print("\nRUN_ZOOM_18 is off: 132 tiles for detail this render size "
          "cannot show. Turn it on when you intend to crop in.")
Basemap: ESRI_IMAGERY z=15 → 3×2=6 tiles (768×512 px)
Basemap saved: /tmp/scigraphs_basemaps/_composites/basemap_esri_imagery_z15_1787036007.png (391×391 px, 0/6 failed tiles)
zoom 15: 6 tiles, 391 x 391 px, 0.02 s
Promoted 1 edge attribute(s) to point domain for GN propagation
Info: Geometry Nodes modifier added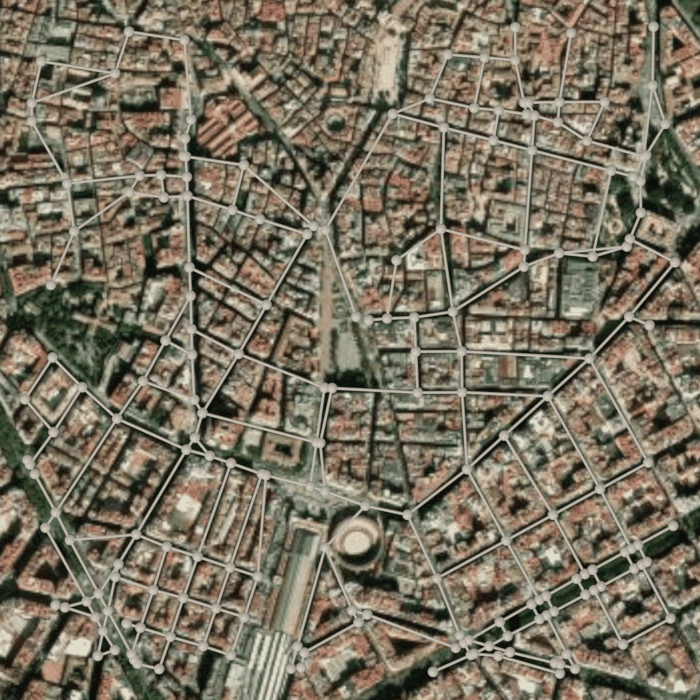
Basemap: ESRI_IMAGERY z=17 → 8×7=56 tiles (2048×1792 px)
Basemap saved: /tmp/scigraphs_basemaps/_composites/basemap_esri_imagery_z17_1787036008.png (1564×1564 px, 0/56 failed tiles)
zoom 17: 56 tiles, 1564 x 1564 px, 0.35 s
  Promoted 1 edge attribute(s) to point domain for GN propagation
Info: Geometry Nodes modifier added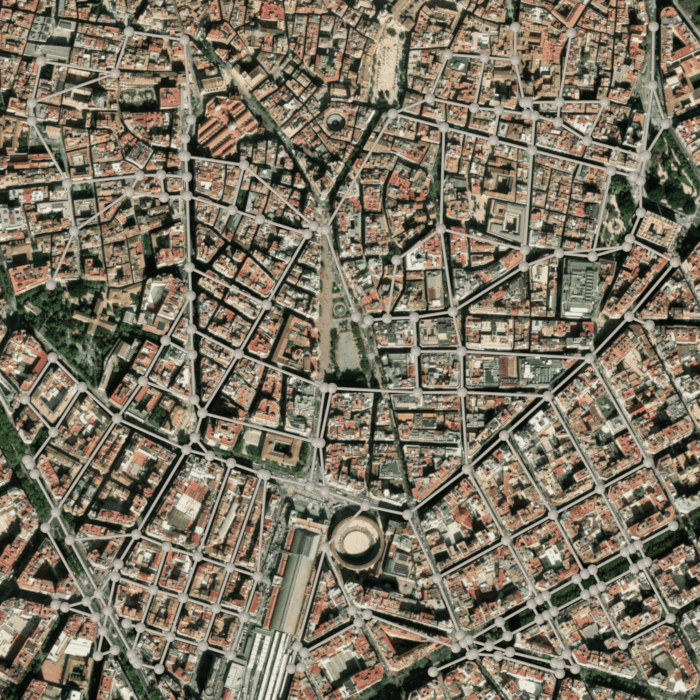
RUN_ZOOM_18 is off: 132 tiles for detail this render size cannot show. Turn it on when you intend to crop in.7 · A refusal
imagery() prints the estimate before it spends anything and refuses over MAX_TILES. Not an exception: it returns ok=False with an error naming the count and the fix, and leaves the existing drape in place. A request that failed is no reason to throw away a photograph that succeeded.
refused = sg.context.imagery(surface, source="ESRI_IMAGERY", zoom=19,
                             verbose=False)
print("ok:", refused["ok"])
print("error:", refused["error"])
print("still wearing imagery:", sg.context.has_imagery(surface),
      "-", surface.get("scigraphs_imagery_name"))

check("a refused fetch leaves the previous drape alone",
      refused["ok"] is False and sg.context.has_imagery(surface))
REFUSING TO FETCH: 650 tiles at zoom 19 is over the 256-tile ceiling; lower `zoom` (each step down quarters the count) or shrink the radius
keeping the drape already on Context_Ground: Esri · Satellite (World Imagery). It is left over from an earlier call, not the result of this one.
ok: False
error: 650 tiles at zoom 19 is over the 256-tile ceiling; lower `zoom` (each step down quarters the count) or shrink the radius
still wearing imagery: True - Esri · Satellite (World Imagery)
[PASS] a refused fetch leaves the previous drape aloneTrue8 · The custom WMS route
XYZ tiles are one protocol. The other is WMS, how national mapping agencies publish orthophotography: one GetMap request, one image, your choice of bounding box and pixel size, in a CRS you name. SciGraphs sends VERSION=1.3.0, CRS=EPSG:4326, a 2048 × 2048 raster and the bbox in latitude-first order, which is what 1.3.0 requires for that CRS and a common source of blank images against servers that expect the 1.1.1 order.
The image comes back linear in latitude and longitude rather than Web Mercator; latlon_to_image_uv handles that as WGS84_LINEAR, a plain bbox rescale. Nothing else in the drape changes.
The default endpoint below is an OSM-rendered WMS, standing in for the PNOA orthophoto that answered HTTP 502 on every attempt. It stamps a grid of advertising watermarks across its free tier: in the drape, not a fault in the projection, and a reminder that a public WMS is somebody else’s server. Point WMS_URL at your own and they go away.
if RUN_WMS:
    started = time.time()
    result = sg.context.imagery(surface, source="WMS", wms_url=WMS_URL,
                                wms_layer=WMS_LAYER, verbose=True)
    if result["ok"]:
        print(f"  {result['image_size'][0]} x {result['image_size'][1]} px in "
              f"{time.time() - started:.1f} s")
        nb.figure(net, "renders/08_imagery/6_wms",
                  isolate=False, resolution=(720, 720),
                  look='terrain', node_fraction=0.28, width=660,
                  legible=False)
    else:
        print("  the endpoint did not answer; the terrain kept what it had")
else:
    print(f"RUN_WMS is off. It would send one GetMap to {WMS_URL} "
          f"for layer {WMS_LAYER!r}: about 2.5 s and 4 MB when that host is up.")
RUN_WMS is off. It would send one GetMap to https://ows.terrestris.de/osm/service for layer 'OSM-WMS': about 2.5 s and 4 MB when that host is up.9 · The cache
Every tile is written to disk under the system temp directory, keyed by source, zoom and tile index, and read from there next time. That is what makes a re-run free and the usage policies survivable. The stitched composites live in the same tree and dominate the byte count: one 1564 x 1564 PNG is several megabytes against about 26 kB for a tile.
cache_root, files, total_bytes = sg.context.imagery_cache_dir()
print(f"{files} files, {total_bytes / 1e6:.1f} MB")
print("under the system temp directory; `sg.context.clear_imagery_cache()` "
      "empties it")
428 files, 514.6 MB
under the system temp directory; `sg.context.clear_imagery_cache()` empties it10 · The last figure
Back to satellite, at zoom 17, overhead like every other figure in the suite.
There is no raking second frame to show that the picture sits on a surface and not on a plane. A couple of dozen meters of relief across 1.44 km is under two percent of the frame, and an oblique camera does not rescue a number that small. Notebook 11 reads relief from straight overhead with a low sun and an elevation tint, from Granada; a hillshade of Ciutat Vella is a blank. What is left here is the measurement below, of a real DEM.
sg.context.imagery(surface, source="ESRI_IMAGERY", zoom=ZOOM, verbose=False)

box = sg.context.bbox(surface)
print(f"the surface under the photograph: {box['size'][2] / 0.001:.0f} m of "
      f"relief across {box['size'][0] / 0.001:.0f} m")
print(f"  {box['size'][2] / box['size'][0] * 100:.1f}% of the frame's width, "
      "and real elevation:", sg.context.is_real_elevation(surface))

path = nb.render(net, "renders/08_imagery/7_satellite_overhead",
                 isolate=False, resolution=(900, 900),
                 look='terrain', node_fraction=0.28,
                 ground=surface, verbose=False)
nb.show(path)
# The photograph covers the frame, so the 60 % ink ceiling would fail every
# drape here.
nb.check_render(path, maximum=0.995)

print("\nattribution required on anything published from this notebook:")
sg.context.attribution(ctx["objects"])
Basemap: ESRI_IMAGERY z=17 → 8×7=56 tiles (2048×1792 px)
Basemap saved: /tmp/scigraphs_basemaps/_composites/basemap_esri_imagery_z17_1787036009.png (1564×1564 px, 0/56 failed tiles)
the surface under the photograph: 0 m of relief across 1440 m
0.0% of the frame's width, and real elevation: False
Promoted 1 edge attribute(s) to point domain for GN propagation
Info: Geometry Nodes modifier added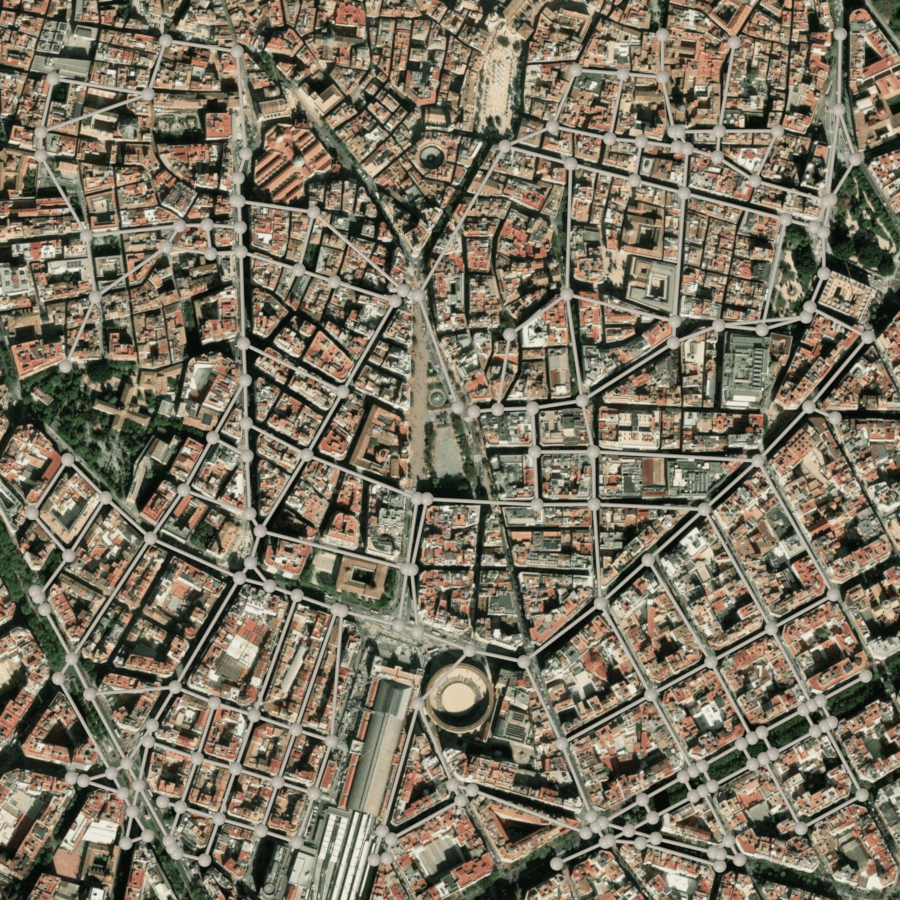
[PASS] 7_satellite_overhead.png legible — 92.2% ink (healthy range 0.5–100%)

attribution required on anything published from this notebook:
  Tiles © Esri — Source: Esri, Maxar, Earthstar Geographics, and the GIS User Community
11 · Saving
output_dir = nb.out("12_imagery")
output_dir.mkdir(parents=True, exist_ok=True)

rows = ["zoom,tiles,meters_per_pixel,pixels_across_frame,over_limit"]
for zoom in range(15, 20):
    estimate = sg.context.imagery_estimate(bounds, "ESRI_IMAGERY", zoom,
                                           verbose=False)
    resolution = meters_per_pixel(CENTER[0], zoom)
    rows.append(f"{zoom},{estimate['tiles']},{resolution:.3f},"
                f"{span_m / resolution:.0f},{estimate['over_limit']}")
(output_dir / "zoom_cost.csv").write_text("\n".join(rows) + "\n", encoding="utf-8")

rows = ["source,provider,max_zoom,attribution"]
for key, info in catalog.items():
    rows.append(f'{key},{info["provider"]},{info["max_zoom"]},'
                f'"{info["attribution"]}"')
(output_dir / "imagery_sources.csv").write_text("\n".join(rows) + "\n",
                                                encoding="utf-8")

print("written to", nb.rel(output_dir))
for entry in sorted(output_dir.iterdir()):
    print("  ", entry.name, f"{entry.stat().st_size / 1e3:.1f} kB")
written to notebooks/out/12_imagery
imagery_sources.csv 1.3 kB
zoom_cost.csv 0.2 kBSummary
| Question | Call |
|---|---|
| What can I drape without a key? | sg.context.imagery_sources() |
| What will it cost? | sg.context.imagery_estimate(bounds, source, zoom) |
| Drape it | sg.context.imagery(terrain, source=..., zoom=...) |
| Terrain and drape in one call | terrain(..., imagery=...), add_context(..., imagery=...) |
| Did it really work? | sg.context.has_imagery(terrain) |
| What must I credit? | sg.context.attribution(objects) |
| Inside Blender | bpy.ops.scigraphs.osmnx_fetch_basemap() |